Overview
The LiveKit Agents SDK includes access to extensive detail about each session, which you can collect locally and integrate with other systems. For information about data collected in LiveKit Cloud, see the Insights in LiveKit Cloud overview. To choose which observability data is collected per session (audio, transcript, traces, logs), see Session recording options.
Session transcripts and reports
Session transcripts, logs, and history are available in the Agent insights tab for each session. It provides a unified timeline that combines turn-by-turn transcripts (including tool calls and handoffs), traces capturing the execution flow of each stage in the voice pipeline, runtime logs from the agent server, and audio recordings that you can play back or download directly in the browser. All of this data streams in realtime during the session, with transcripts and recordings uploaded once the session completes.
Collect data locally
If you need to collect data locally, you can use the following to build live dashboards, save conversation history, or create a detailed session report:
- The
session.historyobject contains the full conversation. Use this to persist a transcript after the session ends. - SDKs emit events as turns progress, for example,
conversation_item_addedanduser_input_transcribed. Use these to build live dashboards. - A session report gathers identifiers, history, events, and recording metadata in one JSON payload. Use this to create a structured post-session artifact.
Conversation history
The session.history object contains the full conversation. While you can use it to persist a transcript after the session ends, it's an advanced use case and not recommended for most applications.
When using a realtime model without a separate STT plugin, session.history transcripts might be incomplete or arrive after the agent has already responded. For details and workarounds, see Delayed transcription.
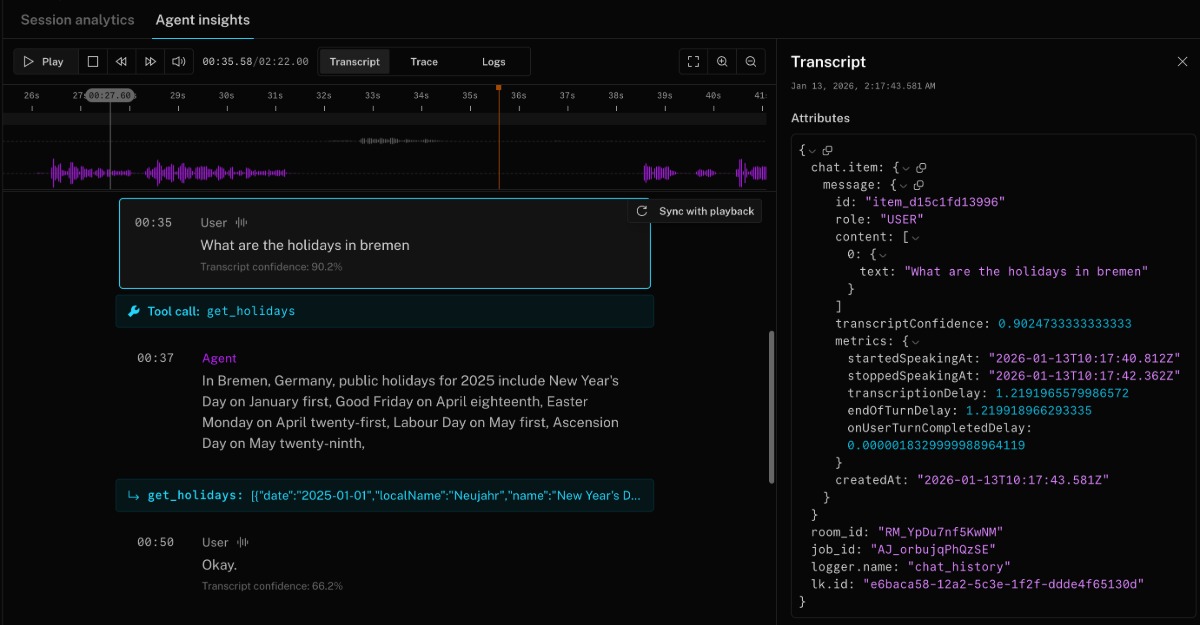
Instead, view the conversation history in the Agent insights tab for each session. It includes turn-by-turn transcripts, tool calls, handoffs, audio recordings, and more. The following screenshot shows a portion of a conversation history in Agent insights with a tool call:
To create a live dashboard or collect conversation history as it happens, subscribe to the conversation_item_added event. For more information, see conversation_item_added.
For a Python example using session.history, see the session close callback example in the GitHub repository.
Capture a session report
Call ctx.make_session_report() inside the on_session_end callback to capture a structured SessionReport with identifiers, conversation history, events, recording metadata, and agent configuration.
The on_session_end callback and other shutdown callbacks run within the shutdown_process_timeout window, which defaults to 10 seconds. If your post-session work (such as writing a report or calling an external API) might exceed this limit, increase the timeout in your WorkerOptions. See the JobContext reference for details.
import jsonfrom datetime import datetimefrom livekit.agents import JobContext, AgentServerserver = AgentServer()async def on_session_end(ctx: JobContext) -> None:report = ctx.make_session_report()report_dict = report.to_dict()current_date = datetime.now().strftime("%Y%m%d_%H%M%S")filename = f"/tmp/session_report_{ctx.room.name}_{current_date}.json"with open(filename, 'w') as f:json.dump(report_dict, f, indent=2)print(f"Session report for {ctx.room.name} saved to {filename}")@server.rtc_session(agent_name="my-agent", on_session_end=on_session_end)async def entrypoint(ctx: JobContext):await ctx.connect()# ...
import { defineAgent, type JobContext } from '@livekit/agents';import { writeFile } from 'node:fs/promises';const onSessionEnd = async (ctx: JobContext) => {const report = ctx.makeSessionReport();const currentDate = new Date().toISOString().replace(/[:.]/g, '-').slice(0, -5);const filename = `/tmp/session_report_${ctx.room.name}_${currentDate}.json`;await writeFile(filename, JSON.stringify(report, null, 2));console.log(`Session report for ${ctx.room.name} saved to ${filename}`);};export default defineAgent({entry: async (ctx: JobContext) => {await ctx.connect();// ...ctx.addShutdownCallback(async () => {await onSessionEnd(ctx);});},});
The report includes fields such as:
- Job, room, and participant identifiers
- Complete conversation history with timestamps
- All session events (transcription, speech detection, handoffs, etc.)
- Audio recording metadata and paths (when recording is enabled)
- Agent session options and configuration
The per-message llm_node_ttft and tts_node_ttfb fields in session reports are only populated by the STT-LLM-TTS pipeline. These fields are always empty when using a realtime model.
Record audio or video
Audio recordings are automatically collected and uploaded to LiveKit Cloud for each session. These files are recorded after background voice cancellation (BVC) is applied and are available for playback and download on the Agent insights tab for the session.
If you need to have more fine-grained control over audio recordings and don't require BVC, or want to record both audio and video, you can use LiveKit Egress to capture audio and video directly to your storage provider. The simplest pattern is to start a room composite recorder when your agent joins the room.
from livekit import apiasync def entrypoint(ctx: JobContext):req = api.RoomCompositeEgressRequest(room_name=ctx.room.name,audio_only=True,file_outputs=[api.EncodedFileOutput(file_type=api.EncodedFileType.OGG,filepath="livekit/my-room-test.ogg",s3=api.S3Upload(bucket=os.getenv("AWS_BUCKET_NAME"),region=os.getenv("AWS_REGION"),access_key=os.getenv("AWS_ACCESS_KEY_ID"),secret=os.getenv("AWS_SECRET_ACCESS_KEY"),),)],)lkapi = api.LiveKitAPI()await lkapi.egress.start_room_composite_egress(req)await lkapi.aclose()# ... continue with your agent logic
import {EgressClient,EncodedFileOutput,EncodedFileType,EncodingOptionsPreset,} from 'livekit-server-sdk';const egressClient = new EgressClient(process.env.LIVEKIT_URL.replace('wss://', 'https://'),process.env.LIVEKIT_API_KEY,process.env.LIVEKIT_API_SECRET,);const output = new EncodedFileOutput({fileType: EncodedFileType.MP4,filepath: 'livekit/my-room-test.mp4',output: {case: 's3',value: {accessKey: process.env.AWS_ACCESS_KEY_ID,secret: process.env.AWS_SECRET_ACCESS_KEY,bucket: process.env.AWS_BUCKET_NAME,region: process.env.AWS_REGION,forcePathStyle: true,},},});export default defineAgent({entry: async (ctx: JobContext) => {await egressClient.startRoomCompositeEgress(ctx.room.name ?? 'open-room',output,{layout: 'grid',encodingOptions: EncodingOptionsPreset.H264_1080P_30,audioOnly: false,},);// ... continue with your agent logic},});
Metrics and usage data
AgentSession emits a metrics_collected event whenever new metrics are available. You can log these events directly or forward them to external services.
Subscribe to metrics events
from livekit.agents import metrics, MetricsCollectedEvent@session.on("metrics_collected")def _on_metrics_collected(ev: MetricsCollectedEvent):metrics.log_metrics(ev.metrics)
import { voice, metrics } from '@livekit/agents';session.on(voice.AgentSessionEventTypes.MetricsCollected, (ev) => {metrics.logMetrics(ev.metrics);});
Aggregate usage with ModelUsageCollector
Use ModelUsageCollector to accumulate LLM, TTS, STT, and interruption model usage across a session for cost estimation or billing exports.
from livekit.agents import metrics, MetricsCollectedEvent@session.on("metrics_collected")def _on_metrics_collected(ev: MetricsCollectedEvent):metrics.log_metrics(ev.metrics)async def log_usage():logger.info(f"Usage: {session.usage}")ctx.add_shutdown_callback(log_usage)
import { voice, metrics } from '@livekit/agents';session.on(voice.AgentSessionEventTypes.MetricsCollected, (ev) => {metrics.logMetrics(ev.metrics);});const logUsage = async () => {console.log(`Usage: ${JSON.stringify(session.usage)}`);};ctx.addShutdownCallback(logUsage);
Metrics reference
Each metrics event is included in the LiveKit Cloud trace spans and surfaced as JSON in the dashboard. Use the tables below when you emit the data elsewhere.
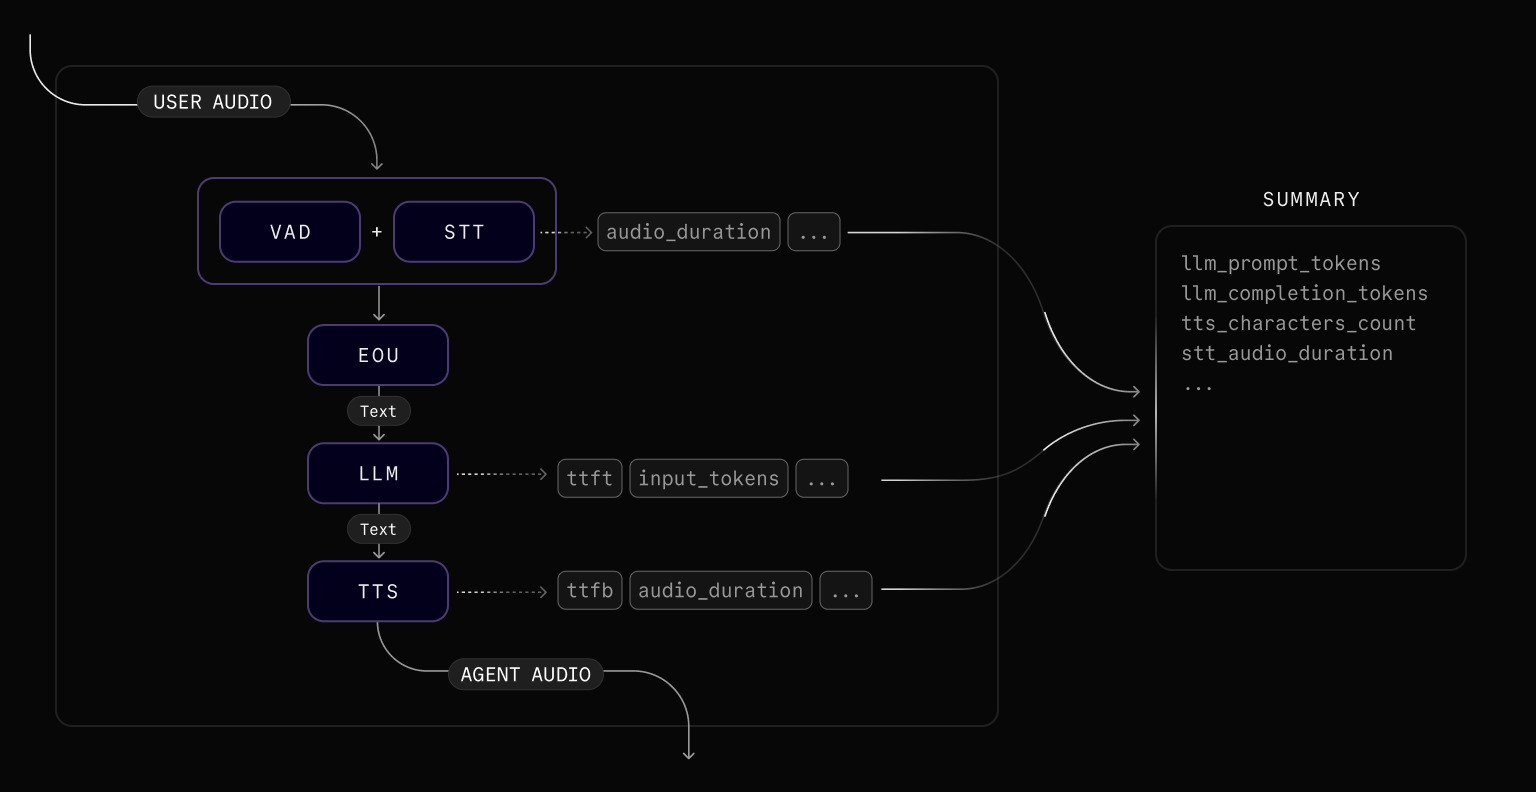
Voice-activity-detection (VAD)
VADMetrics is emitted periodically by the VAD model as it processes audio. It provides visibility into the VAD's operational performance, including how much time it spends idle versus performing inference operations and how many inference operations it completes. This data can be useful for diagnosing latency in speech turn detection.
| Metric | Description |
|---|---|
idle_time | The amount of time (seconds) the VAD spent idle, not performing inference. |
inference_duration_total | The total amount of time (seconds) spent on VAD inference operations. |
inference_count | The number of VAD inference operations performed. |
| Metric | Description |
|---|---|
idleTimeMs | The amount of time (milliseconds) the VAD spent idle, not performing inference. |
inferenceDurationTotalMs | The total amount of time (milliseconds) spent on VAD inference operations. |
inferenceCount | The number of VAD inference operations performed. |
Speech-to-text (STT)
STTMetrics is emitted after the STT model processes the audio input. This metrics event is only available when an STT component is configured (Realtime APIs do not emit it).
| Metric | Description |
|---|---|
audio_duration | The duration (seconds) of the audio input received by the STT model. |
duration | For non-streaming STT, the amount of time (seconds) it took to create the transcript. Always 0 for streaming STT. |
streamed | True if the STT is in streaming mode. |
| Metric | Description |
|---|---|
audioDurationMs | The duration (milliseconds) of the audio input received by the STT model. |
durationMs | For non-streaming STT, the amount of time (milliseconds) it took to create the transcript. Always 0 for streaming STT. |
streamed | true if the STT is in streaming mode. |
End-of-utterance (EOU)
EOUMetrics is emitted when the user is determined to have finished speaking. It includes metrics related to end-of-turn detection and transcription latency.
EOU metrics are available in Realtime APIs when turn_detection is set to VAD or LiveKit's turn detector plugin. When using server-side turn detection, EOUMetrics is not emitted.
| Metric | Description |
|---|---|
end_of_utterance_delay | Time (in seconds) from the end of speech (as detected by VAD) to the point when the user's turn is considered complete. This includes any transcription_delay. |
transcription_delay | Time (seconds) between the end of speech and when the final transcript is available. |
on_user_turn_completed_delay | Time (in seconds) taken to execute the on_user_turn_completed callback. |
speech_id | A unique identifier indicating the user's turn. Not present when end-of-utterance fires without a detected speech segment. |
| Metric | Description |
|---|---|
endOfUtteranceDelayMs | Time (in milliseconds) from the end of speech (as detected by VAD) to the point when the user's turn is considered complete. This includes any transcriptionDelayMs. |
transcriptionDelayMs | Time (milliseconds) between the end of speech and when the final transcript is available. |
onUserTurnCompletedDelayMs | Time (in milliseconds) taken to invoke the Agent.onUserTurnCompleted callback. |
lastSpeakingTimeMs | Timestamp (milliseconds) of when the user last stopped speaking. |
speechId | A unique identifier indicating the user's turn. Not present when end-of-utterance fires without a detected speech segment. |
LLM
LLMMetrics is emitted after each LLM inference completes. Tool calls that run after the initial completion emit their own LLMMetrics events.
| Metric | Description |
|---|---|
duration | The amount of time (seconds) it took for the LLM to generate the entire completion. |
completion_tokens | The number of tokens generated by the LLM in the completion. |
prompt_tokens | The number of tokens provided in the prompt sent to the LLM. |
prompt_cached_tokens | The number of cached tokens in the input prompt. |
speech_id | A unique identifier representing a turn in the user input. Not present for proactive agent responses, tool-call follow-ups, or other completions not tied to a user speech turn. |
total_tokens | Total token usage for the completion. |
tokens_per_second | The rate of token generation (tokens/second) by the LLM to generate the completion. |
ttft | The amount of time (seconds) that it took for the LLM to generate the first token of the completion. |
| Metric | Description |
|---|---|
durationMs | The amount of time (milliseconds) it took for the LLM to generate the entire completion. |
completionTokens | The number of tokens generated by the LLM in the completion. |
promptTokens | The number of tokens provided in the prompt sent to the LLM. |
promptCachedTokens | The number of cached tokens in the input prompt. |
speechId | A unique identifier representing a turn in the user input. Not present for proactive agent responses, tool-call follow-ups, or other completions not tied to a user speech turn. |
totalTokens | Total token usage for the completion. |
tokensPerSecond | The rate of token generation (tokens/second) by the LLM to generate the completion. |
ttftMs | The amount of time (milliseconds) that it took for the LLM to generate the first token of the completion. |
Realtime model
RealtimeModelMetrics is emitted after each response from a realtime model. It replaces LLMMetrics in agents that use a realtime model instead of an STT-LLM-TTS pipeline.
| Metric | Description |
|---|---|
duration | The amount of time (seconds) it took to receive the full response from the model. |
session_duration | The total connection time (seconds) for session-based billing. |
ttft | Time to first audio token (seconds). Returns -1 if the model did not generate audio tokens. Unlike LLMMetrics.ttft, this value can be negative. |
input_tokens | Total number of input tokens. |
output_tokens | Total number of output tokens. |
total_tokens | Total token usage for the response. |
tokens_per_second | The rate of output token generation (tokens/second). |
input_token_details | Breakdown of input tokens by modality: audio_tokens, text_tokens, image_tokens, cached_tokens, and cached_tokens_details (further split by modality). |
output_token_details | Breakdown of output tokens by modality: text_tokens, audio_tokens, image_tokens. |
| Metric | Description |
|---|---|
durationMs | The amount of time (milliseconds) it took to receive the full response from the model. |
sessionDurationMs | The total connection time (milliseconds) for session-based billing. Not present for providers that don't use session-based billing. |
ttftMs | Time to first audio token (milliseconds). Returns -1 if the model did not generate audio tokens. Unlike LLMMetrics.ttftMs, this value can be negative. |
inputTokens | Total number of input tokens. |
outputTokens | Total number of output tokens. |
totalTokens | Total token usage for the response. |
tokensPerSecond | The rate of output token generation (tokens/second). |
inputTokenDetails | Breakdown of input tokens by modality: audioTokens, textTokens, imageTokens, cachedTokens, and cachedTokenDetails (further split by modality). |
outputTokenDetails | Breakdown of output tokens by modality: textTokens, audioTokens, imageTokens. |
Text-to-speech (TTS)
TTSMetrics is emitted after the TTS model generates speech from text input.
| Metric | Description |
|---|---|
audio_duration | The duration (seconds) of the audio output generated by the TTS model. |
characters_count | The number of characters in the text input to the TTS model. |
duration | The amount of time (seconds) it took for the TTS model to generate the entire audio output. |
ttfb | The amount of time (seconds) that it took for the TTS model to generate the first byte of its audio output. |
speech_id | An identifier linking to a user's turn. Not present for speech synthesized independently of a user turn, such as a proactive greeting or say() call. |
streamed | True if the TTS is in streaming mode. |
| Metric | Description |
|---|---|
audioDurationMs | The duration (milliseconds) of the audio output generated by the TTS model. |
charactersCount | The number of characters in the text input to the TTS model. |
durationMs | The amount of time (milliseconds) it took for the TTS model to generate the entire audio output. |
ttfbMs | The amount of time (milliseconds) that it took for the TTS model to generate the first byte of its audio output. |
speechId | An identifier linking to a user's turn. Not present for speech synthesized independently of a user turn, such as a proactive greeting or say() call. |
streamed | true if the TTS is in streaming mode. |
Interruption detection
InterruptionMetrics is emitted when the adaptive interruption model processes overlapping speech. Interruption metrics are only available when the adaptive interruption handling is enabled. Use it to monitor detection latency and request volume for the model.
| Metric | Description |
|---|---|
total_duration | Latest Round Trip Time (RTT) for the inference, in seconds. |
prediction_duration | Latest time taken for inference on the model side, in seconds. |
detection_delay | Latest total time from the onset of overlapping speech to the final prediction, in seconds. |
num_interruptions | Number of interruptions detected for this event. |
num_backchannels | Number of non-interrupting speech events (backchannels) detected for this event. |
num_requests | Number of requests sent to the interruption detection model for this event. |
| Metric | Description |
|---|---|
totalDuration | Latest Round Trip Time (RTT) for the inference, in milliseconds. |
predictionDuration | Latest time taken for inference on the model side, in milliseconds. |
detectionDelay | Latest total time from the onset of overlapping speech to the final prediction, in milliseconds. |
numInterruptions | Number of interruptions detected for this event. |
numBackchannels | Number of non-interrupting speech events (backchannels) detected for this event. |
numRequests | Number of requests sent to the interruption detection model for this event. |
Measure conversation latency
Total conversation latency is the time it takes for the agent to respond to a user's utterance. Approximate it with the following metrics:
total_latency = eou.end_of_utterance_delay + llm.ttft + tts.ttfb
const totalLatency = eou.endOfUtteranceDelay + llm.ttft + tts.ttfb;
OpenTelemetry integration
Set a tracer provider to export the same spans used by LiveKit Cloud to any OpenTelemetry-compatible backend. The following example sends spans to LangFuse.
import base64import osfrom livekit.agents.telemetry import set_tracer_providerdef setup_langfuse(host: str | None = None, public_key: str | None = None, secret_key: str | None = None):from opentelemetry.exporter.otlp.proto.http.trace_exporter import OTLPSpanExporterfrom opentelemetry.sdk.trace import TracerProviderfrom opentelemetry.sdk.trace.export import BatchSpanProcessorpublic_key = public_key or os.getenv("LANGFUSE_PUBLIC_KEY")secret_key = secret_key or os.getenv("LANGFUSE_SECRET_KEY")host = host or os.getenv("LANGFUSE_HOST")if not public_key or not secret_key or not host:raise ValueError("LANGFUSE_PUBLIC_KEY, LANGFUSE_SECRET_KEY, and LANGFUSE_HOST must be set")langfuse_auth = base64.b64encode(f"{public_key}:{secret_key}".encode()).decode()os.environ["OTEL_EXPORTER_OTLP_ENDPOINT"] = f"{host.rstrip('/')}/api/public/otel"os.environ["OTEL_EXPORTER_OTLP_HEADERS"] = f"Authorization=Basic {langfuse_auth}"trace_provider = TracerProvider()trace_provider.add_span_processor(BatchSpanProcessor(OTLPSpanExporter()))set_tracer_provider(trace_provider)async def entrypoint(ctx: JobContext):setup_langfuse()# start your agent
For an end-to-end script, see the LangFuse trace example on GitHub.